In 2001 Goldhaber and the Supernova Cosmology Project published results of a time dilation analysis of 60 supernovae. A plot of their width factor w versus the redshift z is shown below.
If the redshift were due to a tired light effect, the width of a supernova light curve would be independent of the redshift, as shown by the red horizontal line. If the redshift is due to an expanding Universe, the width factor should be w = (1+z) as shown by the blue line. The best fit to the data is the black line, and it is clearly consistent with the blue line and rules out the tired light model. My best fit line is
w = 0.985*(1+z)(1.045 +/- 0.089)using a least sum of absolute errors robust estimator to find the fit and the half-sample bootstrap to estimate the errors. This data excludes the tired light model by more than 11 standard deviations.
Blondin et al. (2008) also studied distant supernovae, but used spectra to judge the age of the supernovae. They found an aging rate that varied like
1/(1+z)(0.97 +/- 0.10),compatible with the expected 1/(1+z) for expanding Universes, but 9.7 standard deviations away from the constant aging rate expected in the tired light model.
The expanding balloon analogy for cosmological models can be used to
show this. The figure below shows the analogy at
two different times.
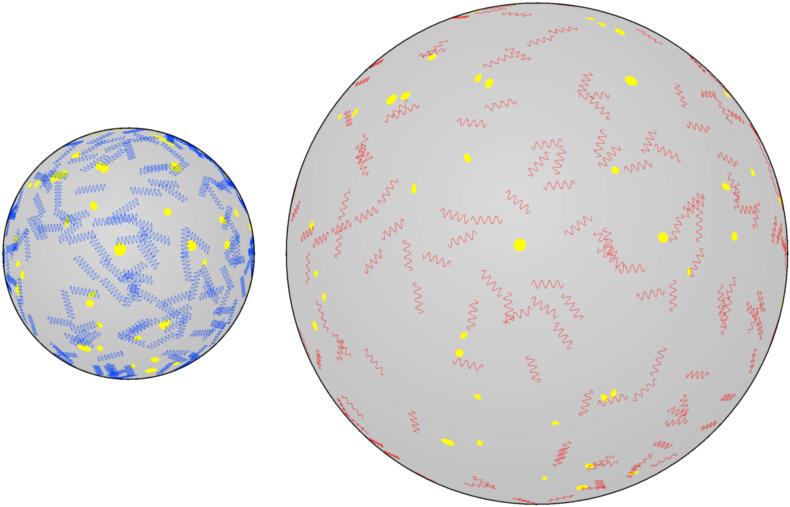
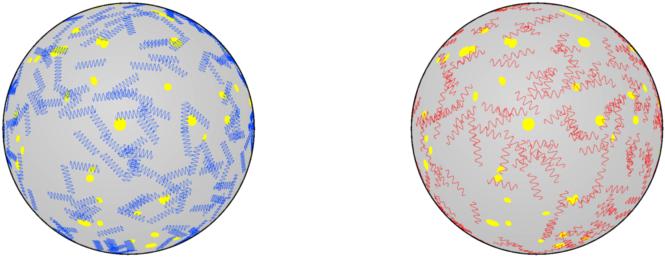
Note that the galaxies (yellow blobs) do not grow, but the distance between galaxies grows, and that the photons move and shift from blue to red as the Universe expands, and the photon density goes down. But in the tired light model, illustrated below, the density does not go down.
Thus in the tired light model the energy of the CMB photons will go down but the density will not go down to match the density of a cooler blackbody. The local Universe is transparent and has a wide range of temperatures, so it does not produce a blackbody, which requires an isothermal absorbing situation. So the CMB must have come from a far away part of the Universe, and its photons will thus lose energy by the tired light effect. The plot below shows what happens if the CMB comes from z = 0.1.
Assume that the CMB starts out as a T = (1+z)*To = 2.998 K blackbody, which is the blue curve. Because the photons only lose energy but do not decrease their density, the resulting red curve is not a blackbody at To = 2.725, but is instead (1+z)3 = 1.331 times a blackbody. The FIRAS data limit this prefactor to 1.00001+/-0.00005, which requires that the CMB come from redshifts less than 0.00005, or distances less than 0.25 Mpc. This is less than the distance to the Andromeda Galaxy M31, and we know the Universe is transparent well beyond this distance. In fact, since millimeter wave emission is observed to come from galaxies at redshifts of 4.7 or higher, the tired light model fails this test by 100,000 standard deviations. Note that the CMB cannot be redshifted starlight. Some diehards refuse to face these facts, and continue to push tired light models of the CMB, but these models do not agree with the observations.