![[Picture of Ulrich]](images/ulrich_1.gif) |
Astronomy |
Access to solar images dating from 1906. Lecture notes on stellar evolution and quantum mechanics. Solar spectral line profiles
|
Astronomy |
|
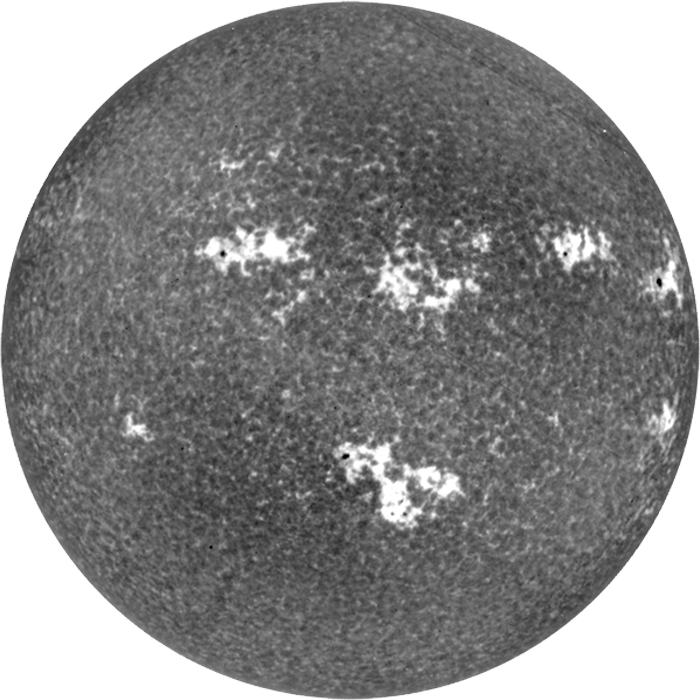
Ulrich, R.K., et al., 2002ApJS..139..259U, Mt. Wilson Synoptic Magnetic Fields (ADS Abstract), (pdf summary, 3 Mbytes) |
|||||||||||
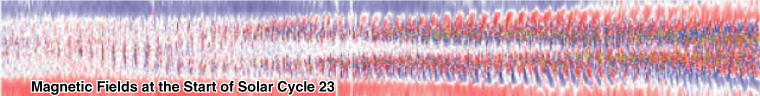
| Bastille Day 2000 | 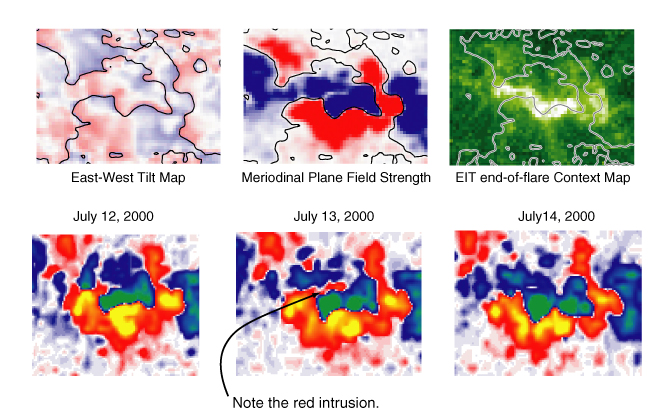 |
Magnetic Maps | 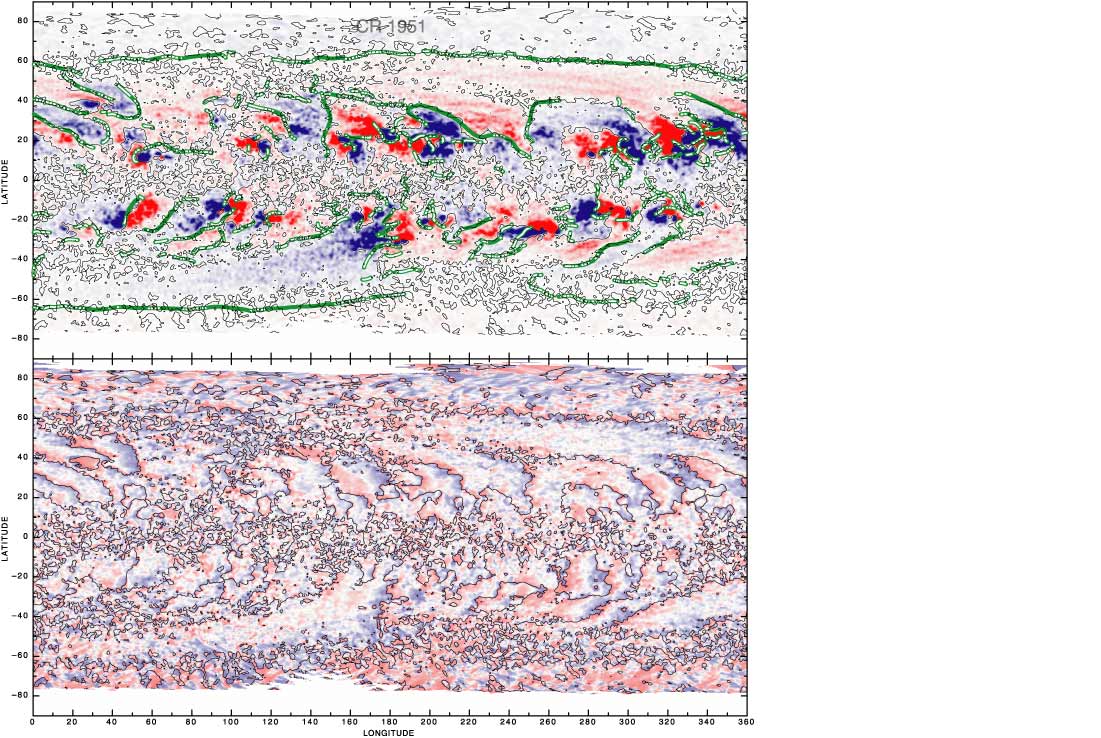 |
||||||||
| Ulrich, R.K., 2001ApJ...560..466U, Very Long-lived Solar Surface Velocity Waves (ADS Abstract) | |||||||||||
| Power Spectra | Rotation Rates | ||||||||||
| Ulrich, R.K., 2005ApJ...620L..123U, The Solar Surface Toroidal Magnetic Field (preprint, in press, 8.7 Mbytes) | |||||||||||
| Time and Latitude dependence of the toroidal field. | |||||||||||
 |
|||||||||||
| Gabriel, A.H. et al., 2002A&A...390.1119G, A search for solar g modes in the GOLF data. (ADS Abstract) | |||||||||||
| Sample Power Spectrum | |||||||||||
 |
Observed Peak Frequencies | ||||||||||
AGU Dec. 2004 Powerpoint: A presentation given at the AGU 2004 winter meeting can be downloaded. One version uses a 130Mbyte avi Movietone clip from 1930. A second version uses a 20 Mbyte avi of the movie clip. Both video clips are played from inside the powerpoint presentation.

