The Pattern of
Rotation Rate Deviation Known as the Torsional
Oscillations
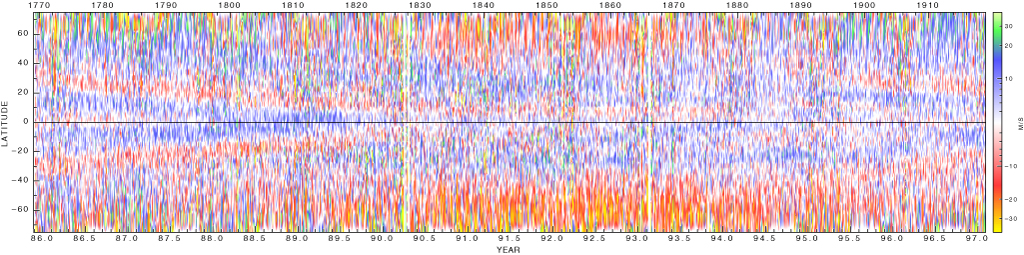
This color-coded chart represents the temporal evolution of the deviations in the rotation rate. The reference for the deviation is an eleven-year average of the differential rotation rate. The blue and green colors represent faster than average rotation rates while the red and yellow colors represent slower than average rotation rates. The zone between blue and red has an enhanced rate of shear and is where active magnetic regions appear at the beginning of the solar cycle.
Data in the form of latitude and longitude dependent velocity deviations is available as seven files: vzon1.dat, vzon2.dat, vzon3.dat, vzon4.dat, vzon5.dat, vzon6.dat and vzon7.dat in a text file format. These files include observations up to 2012. The sign convention has changed relative to earlier files in that the faster than average was previously taken to be negative and is now positive.
Three associated data sets with similar temporal coverage are:
vsec1.dat, vsec2.dat, vsec3.dat, vsec4.dat, vsec5.dat and vsec6.dat
bsec1.dat, bsec2.dat, bsec3.dat, bsec4.dat, bsec5.dat, bsec6.dat and bsec7.dat
bzon1.dat, bzon2.dat, bzon3.dat, bzon4.dat, bzon5.dat, bzon6.dat and bzon7.dat
A brief explanation of the time and latitude structure of these data sets is in the pdf file: torsional_data.