Images and videos
 A characteristic SIGO environments. The SIGO is located in the center of each panel with a zoom-in to the center region. Left panel: projected overdensities of a characteristic SIGO environments. The Dark Matter halos are identified by the black circles. Right panel: a slice of the velocity field is also shown for the same region as in the left panel. See for more details Chiou et al. (2021). |
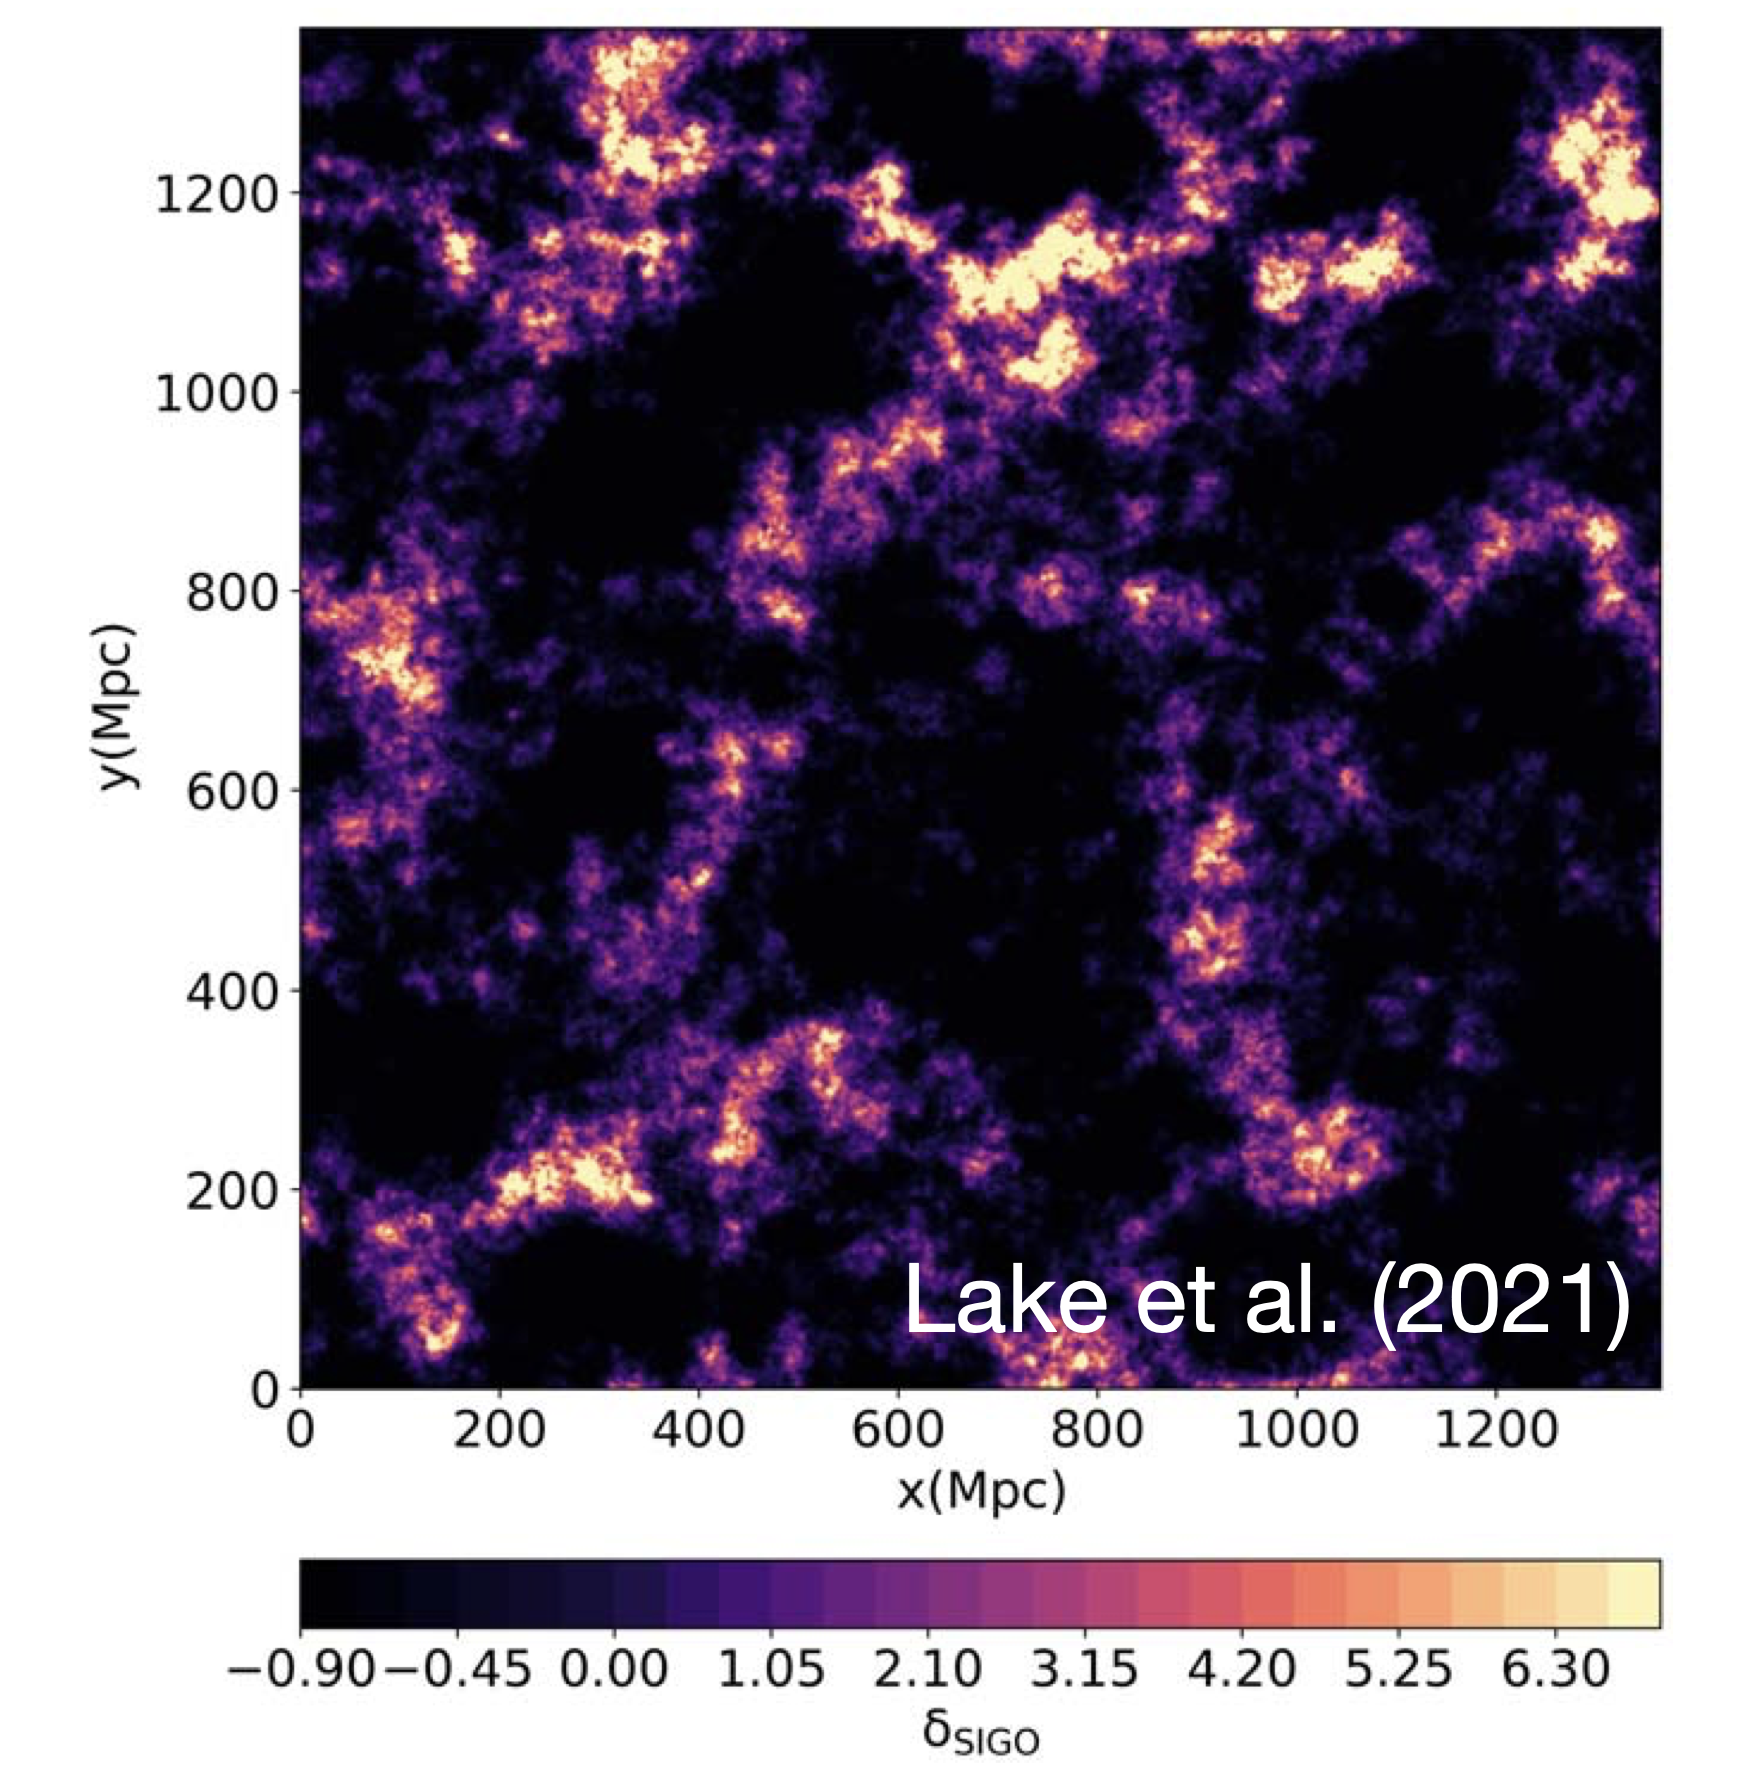 SIGOs' map density contrast at z = 20. Here the color scale represents the fluctuation of SIGOs abundances resulting from the variations in stream velocity on large scales. See for more details Lake et al. (2021). |
|
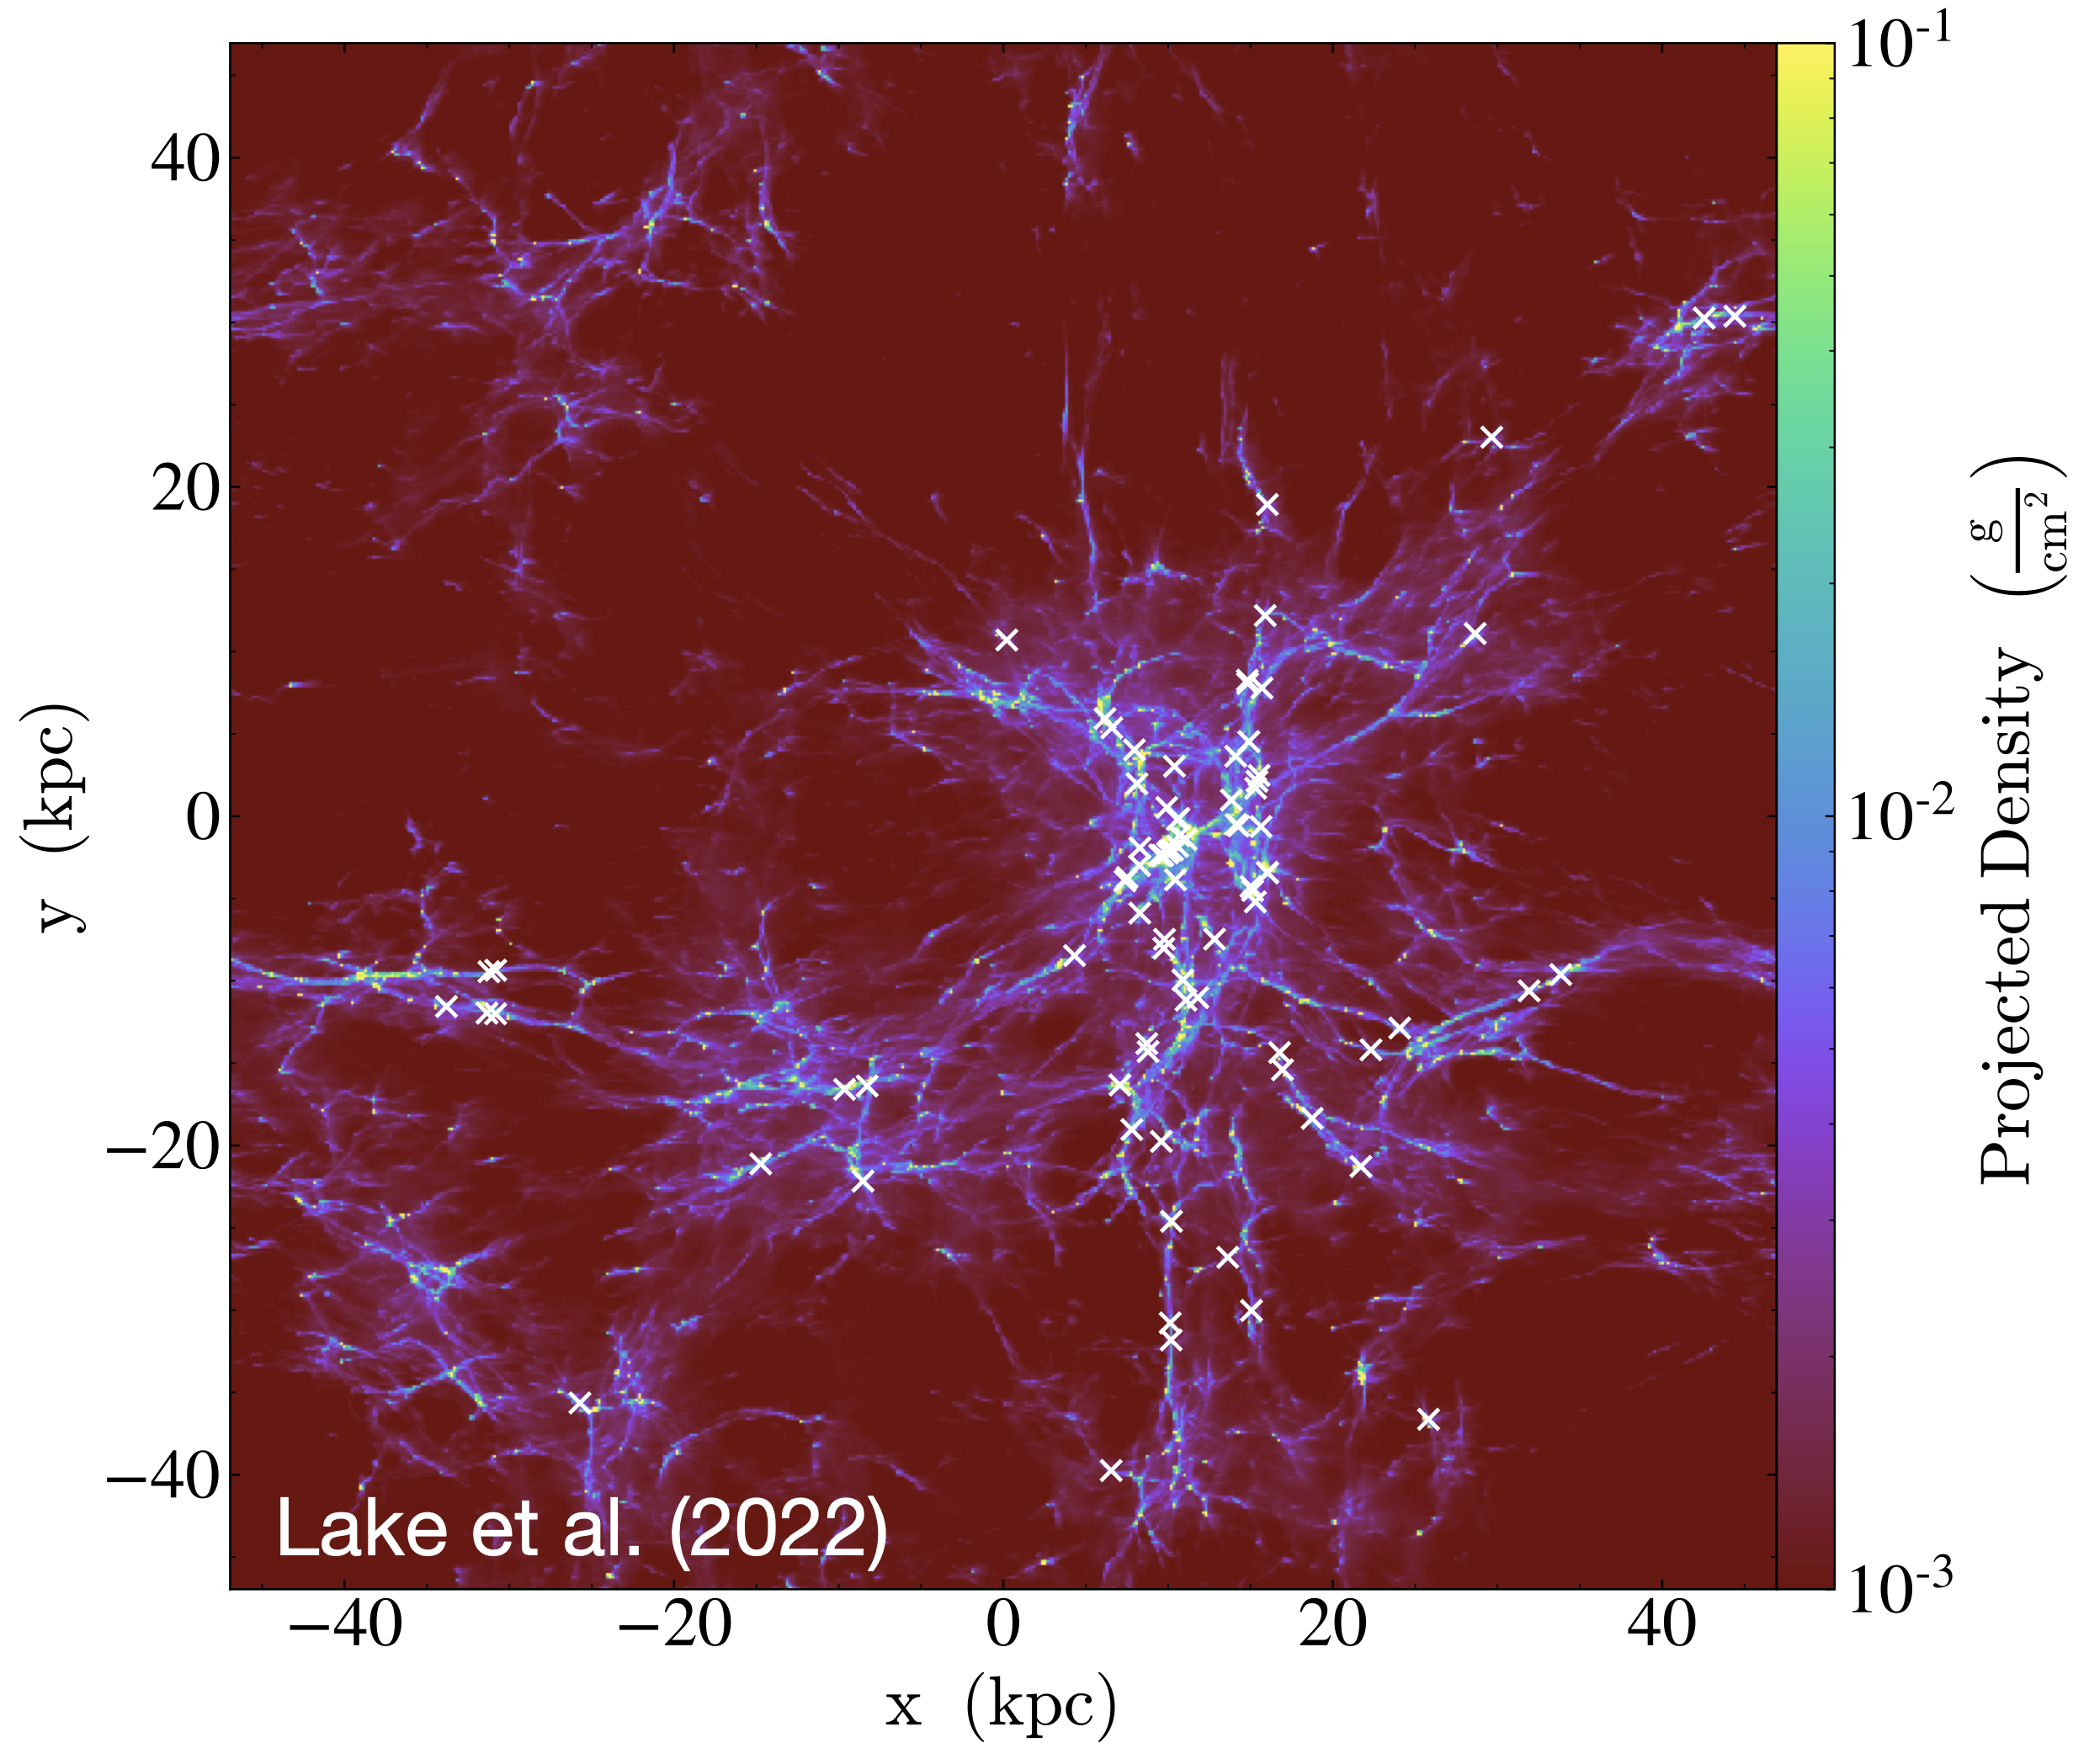 The gas density field in a simulation box with 2σ stream velocity effect. SIGOs are marked with Xs. Note here that SIGOs trace gas and halo abundances on these scales, but they are off-set from the Dark Matter halos. See for more details Lake et al. (2022). |
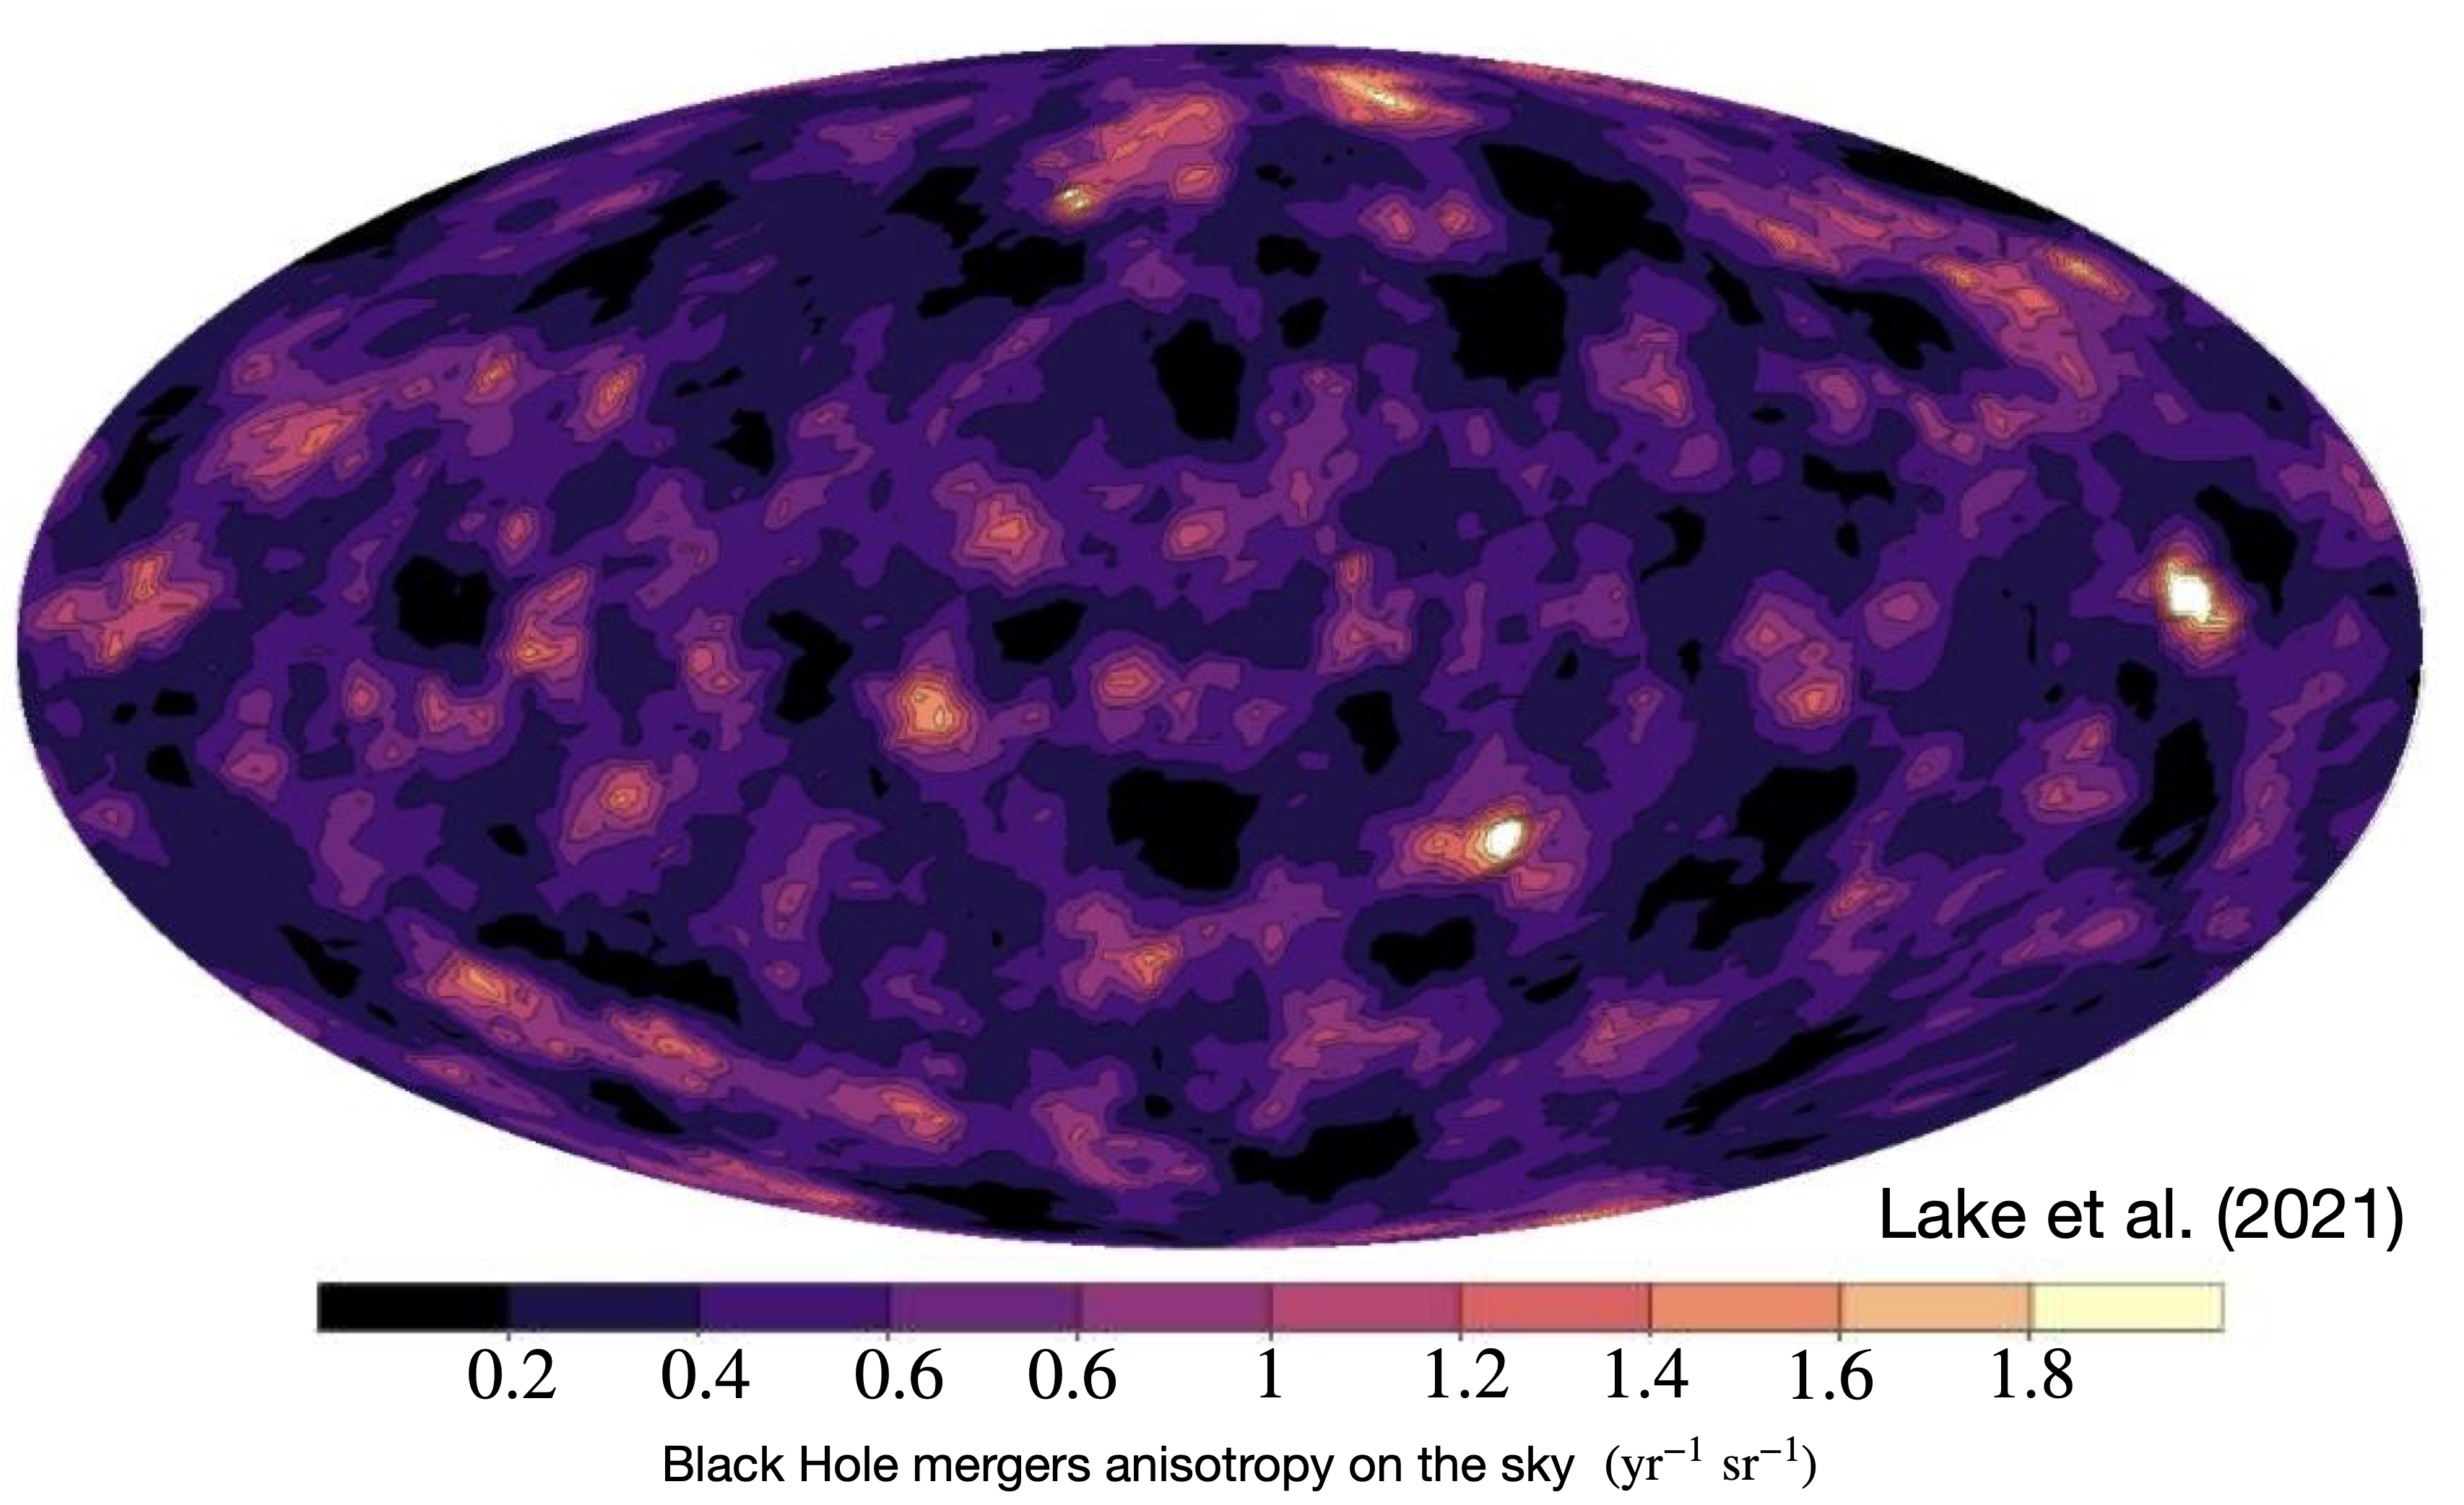 If SIGOs are indeed connected to globular clusters, we can connect the abundance of SIGOs to the abundance of globular clusters and therefore possibly to the abundance of Black-hole binary merger events. As a result, in Lake et al. (2021) we suggested an anisotropy in the distribution of BBH merger events derived from the variation in SIGO abundances on the sky. The Figure shows a sky-map of integrated BBH merger abundances in globular clusters, to a distance of 675 Mpc. Numbers are given in mergers per steradian per year, assuming a merger rate of 10-8 per year per cluster. |
|
|
The creation of a GC-like system at high redshift (z=20). This SIGO is labelled GC-like in the figure, for globular cluster-like candidate. This SIGO, is accreted by a nearby halo (the gas component of which is shown in the movie, the right branch of the plot, with a very low baryon fraction). This accretion produces a more massive merged object, containing the SIGO in its substructure. The final configuration resembles a globular cluster-like candidate. See for more details Lake et al. (2022). |
The Growth of a SIGO: here we show the time evolution of a single SIGO. This SIGO increases its mass by nearly a factor of 10 between its formation (z=24.5) and the final, accreting gas from its surroundings with a similar baryon fraction to the SIGO itself and thereby maintaining its baryon fraction over time. See for more details Lake et al. (2022). |