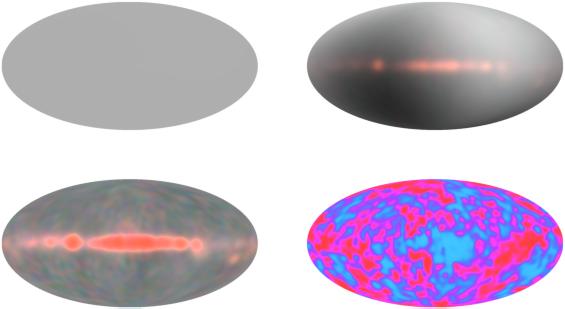
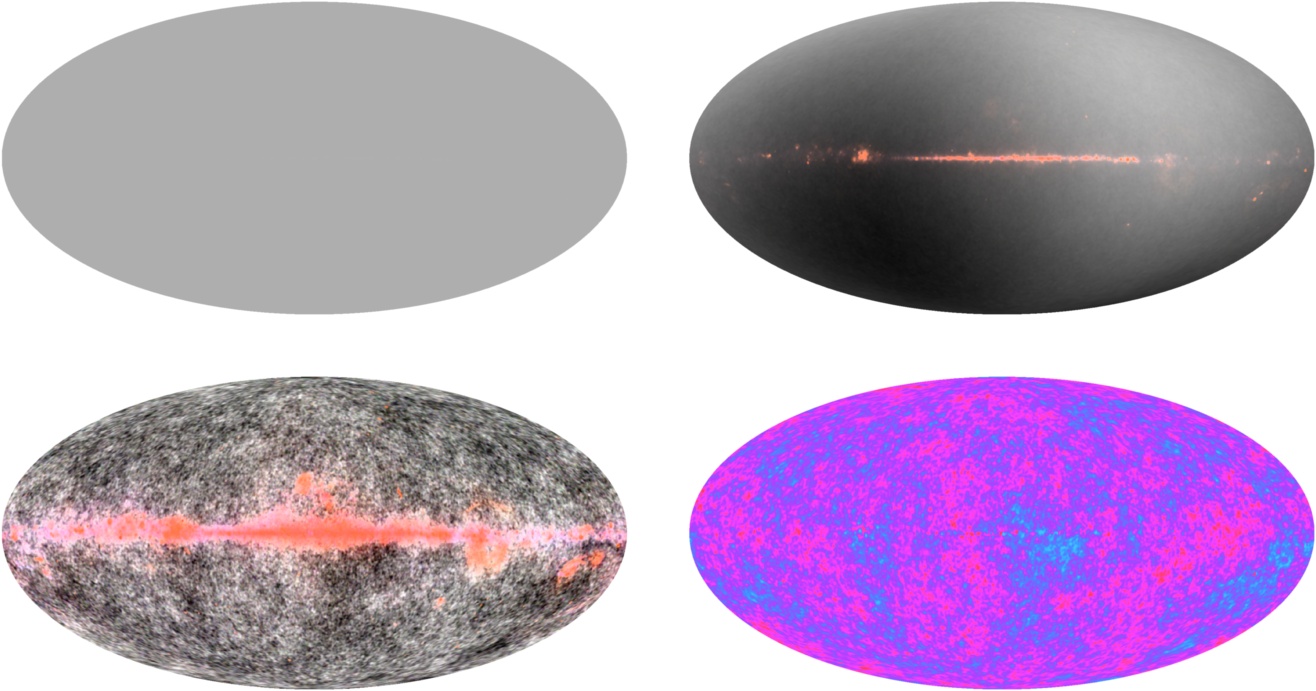
The anisotropy of the cosmic microwave background (CMB) consists of the small temperature fluctuations in the blackbody radiation left over from the Big Bang. The average temperature of this radiation is 2.725 K as measured by the FIRAS instrument on the COBE satellite. Without any contrast enhancement the CMB sky looks like the upper left panel of the figure below. But there are small temperature fluctuations superimposed on this average. One pattern is a plus or minus 0.00335 K variation with one hot pole and one cold pole: a dipole pattern. A velocity of the observer with respect to the Universe produces a dipole pattern with dT/T = v/c by the Doppler shift. The observed dipole indicates that the Solar System is moving at 368+/-2 km/sec relative to the observable Universe in the direction galactic longitude l=263.85o and latitude b=48.25o with an uncertainty slightly smaller than 0.1o. If we subtract the average temperature and expand the contrast by a factor of 400, we get the upper right panel below. This shows the dipole pattern and the emission from the Milky Way which dominates the red color in the picture, which represents the longest wavelength data. After the average temperature and the dipole pattern are removed, there are intrinsic fluctuations in the CMB which can be seen faintly away from the Milky Way in the lower left panel below, which has constrast enhanced by 2000X. Finally we can combine the multiple frequencies in a way that eliminates the Milky Way, giving the CMB map in the lower right with a 30,000X contrast enhancement.
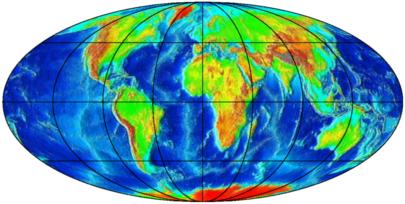 These ovals are all maps of the entire celestial sphere in an equal-area
Mollweide projection. The image at right shows a topographical map of
the Earth in this projection. Note that there is no part of the Earth
that is not included in the oval, and thus there is nothing "outside"
the WMAP map.
These ovals are all maps of the entire celestial sphere in an equal-area
Mollweide projection. The image at right shows a topographical map of
the Earth in this projection. Note that there is no part of the Earth
that is not included in the oval, and thus there is nothing "outside"
the WMAP map.
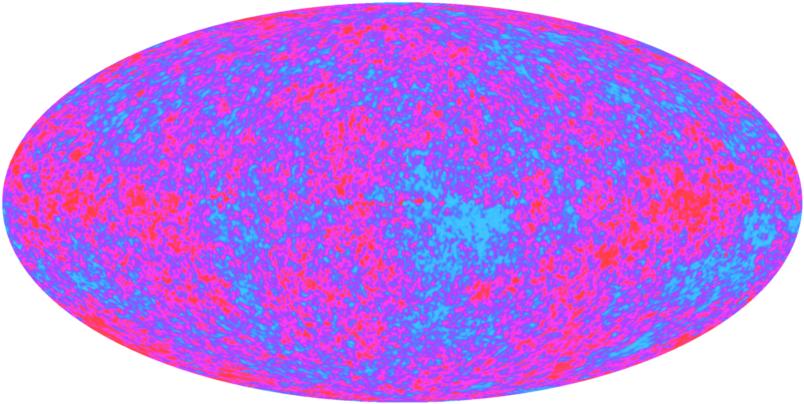
The effect of galactic emission is very small, and most of it is removed by the internal linear combination technique, as shown here.
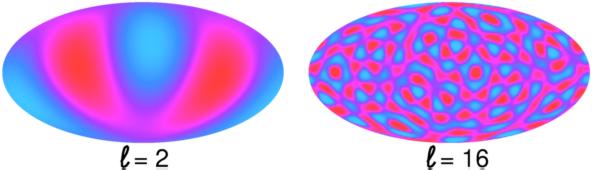
The angular power spectrum of the anisotropy of the CMB
contains information about the formation of the Universe and its
current contents. This angular power spectrum is a plot of how much
the temperature varies from point to point on the sky (the y-axis
variable) vs. the angular frequency ell (the x-axis
variable). Ell=10 means that there are ten cycles in the fluctuation
around the whole sky, while ell=100 means that there are 100 cycles
around the sky.
Many groups are trying the measure the angular power spectrum, and these data have answered fundamental questions about the nature of the Universe. So it gets into the newspapers often, from the COBE results in April 1992 to the BOOMERanG results in April 2000 and the WMAP results in February 2003.
With 5 years of WMAP data, and improved ground-based and balloon-borne experiments, the consistency with ΛCDM remains excellent.
Tutorial:
Part 1 |
Part 2 |
Part 3 |
Part 4
FAQ |
Age |
Distances |
Bibliography |
Relativity
© 1999-2013 Edward L. Wright. Last modified 03 Jan 2013