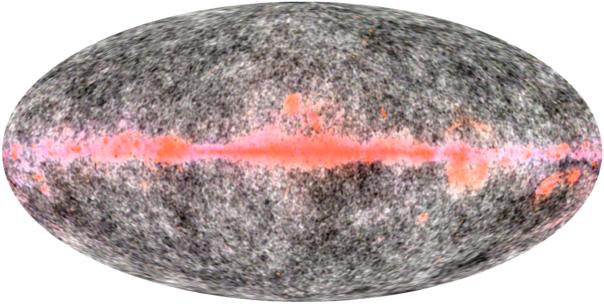
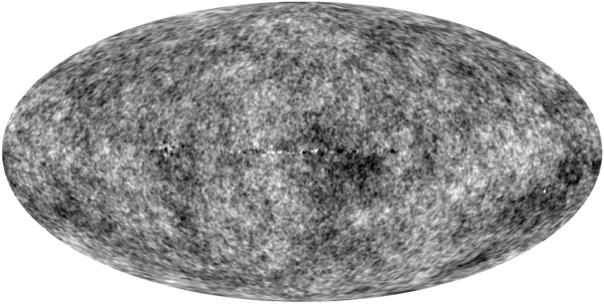
There are two ways to reduce the galactic contamination in CMB anisotropy data. The first way is to make observations in bands where the contrast between the CMB anisotropy and the Milky Way emission is greatest, which are near 70 GHz. The NASA Explorer satellite WMAP has 3 bands at or near this minimum in the galactic emission with microwave designations Q, V & W. The second way to reduce the galactic contamination is to take data in a band where the Milky Way is strong and subtract some of that signal from the bands with weak galactic emission. This internal linear combination technique (ILC) was first used on COBE DMR data by Wright in 1991. The image rollover above illustrates the results: run your mouse over the image to toggle between the internal linear combination "reduced galaxy" map and an RGB image constructed from the WMAP QVW bands (41, 61 and 94 GHz). Both maps are based on the public WMAP 3 year data. The RGB image uses maps smooothed to matching resolutions by Xi Chen of UCLA, while the ILC image is a grey scale display of the wmap_ilc_3yr_v2.fits file from the LAMBDA data center. See Hinshaw et al. (2006) for a more complete description of the map making and the ILC method.
The maps are on a -0.25 to +0.25 mK scale. Where one or more of the channels of the RGB map is saturated, all of the channels are scaled down by the same factor, which preserves the hue in the saturated regions.
FAQ | Tutorial : Part 1 | Part 2 | Part 3 | Part 4 | Age | Distances | Bibliography | Relativity
© 2006 Edward L. Wright. Last modified 18 Jul 2006