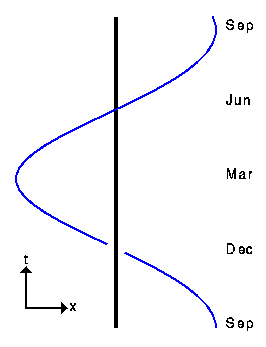
Any discussion of cosmology requires a careful consideration of what we can see and when we can see it. A good way to keep track of these concepts is the space-time diagram. A space-time diagram is nothing more than a graph showing the position of objects as a function of time. The usual convention is that time runs up the diagram, so the bottom is the past, or early times, and the top is the future, or late times. A point on this graph describes both a position (the horizontal or x coordinate) and a time (the vertical or t coordinate). A "point" in space-time is called an event.
The picture above shows a space-time diagram of the Earth going around the Sun. This figure uses perspective to try to show two spatial dimensions and the time axis on a two dimensional sheet of paper, but usually we will just show one spatial axis and avoid perspective.
The line representing the position of the Earth as a function of time is
called a worldline. The slope of the worldline for a particle
shows its velocity in the reference frame of the diagram.