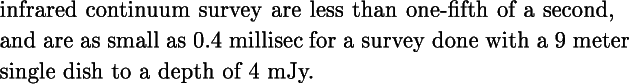
Click on Figures for the Postscript file, if available, or here for the
Latex file of the text.
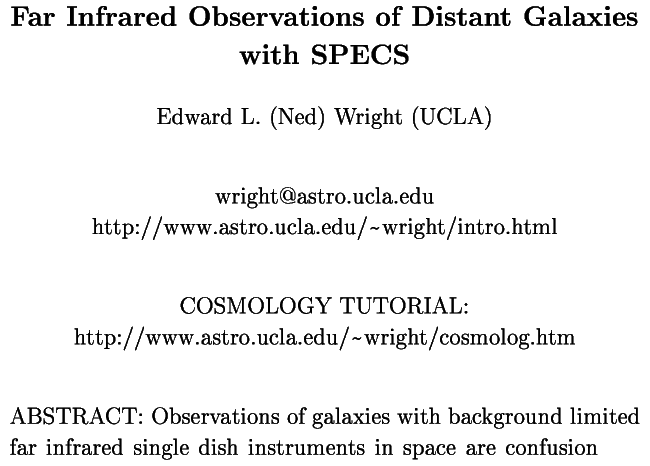
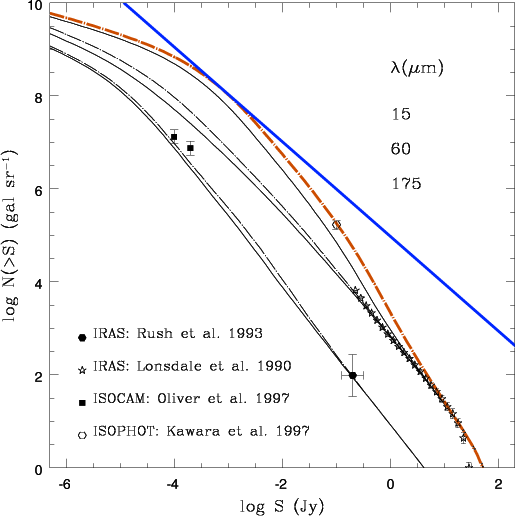
From Figure 3 of Guiderdoni et al. (
astro-ph/9707134)
The 175 micron counts are emphasized in gold, and a line with slope -1
tangent to the model counts is added in blue.
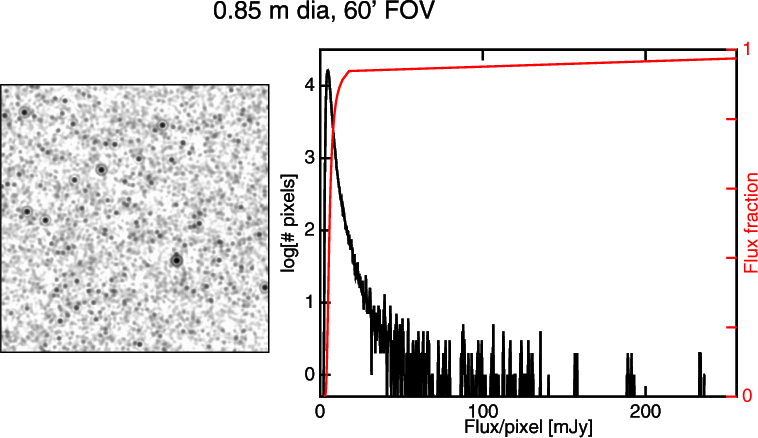
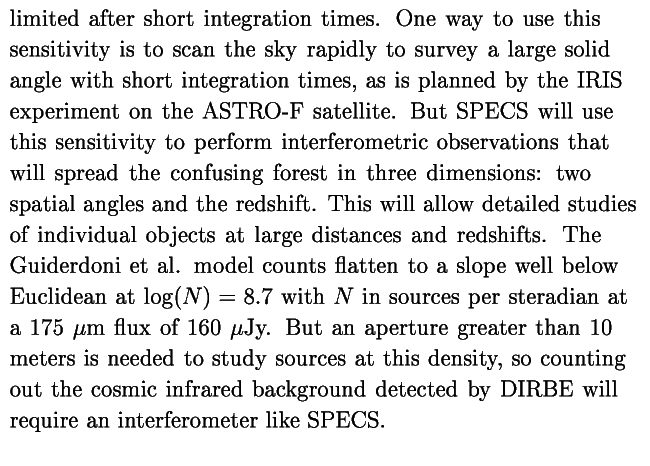
Left: Simulated image at 175 microns
of a 60' FOV with an 0.85 meter diameter telescope.
Notice that there are many faint sources confusing measurements of the
brighter sources in the field. Right: The pixel flux histogram in black
and the total fraction of the integrated background from sources fainter
than SLIM is shown in black.
Notice that the unconfused sources to the right of the peak in the pixel
flux histogram contribute only a small fraction of the integrated
background.
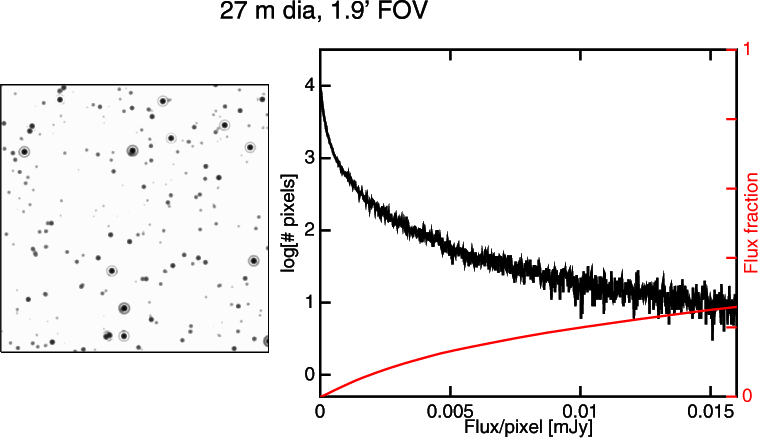
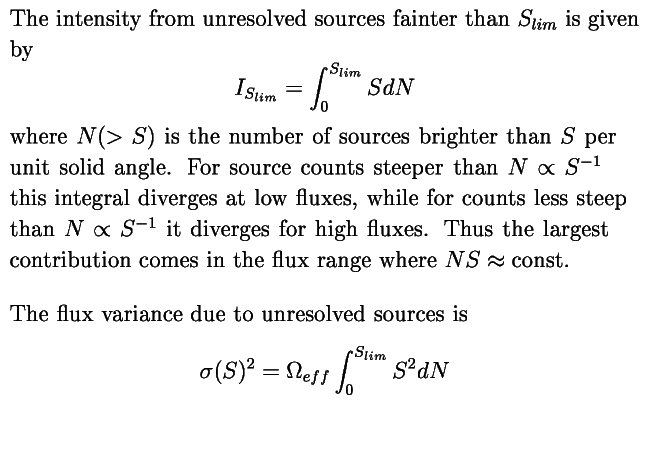
Left: Simulated image at 175 microns
of a 1.9' FOV with a 27 meter diameter telescope.
Notice that there are few faint sources confusing measurements of the
brighter sources in the field. Right: The pixel flux histogram in black
and the total fraction of the integrated background from sources fainter
than SLIM is shown in black.
Notice that the unconfused sources to the right of the peak in the pixel
flux histogram contribute only a small fraction of the integrated
background.
© 1999 Edward L. Wright - Posted
Tue Jun 8 07:25:04 PDT 1999
Ned's home
page |
Cosmology Tutorial | Fractal Dust
Grains