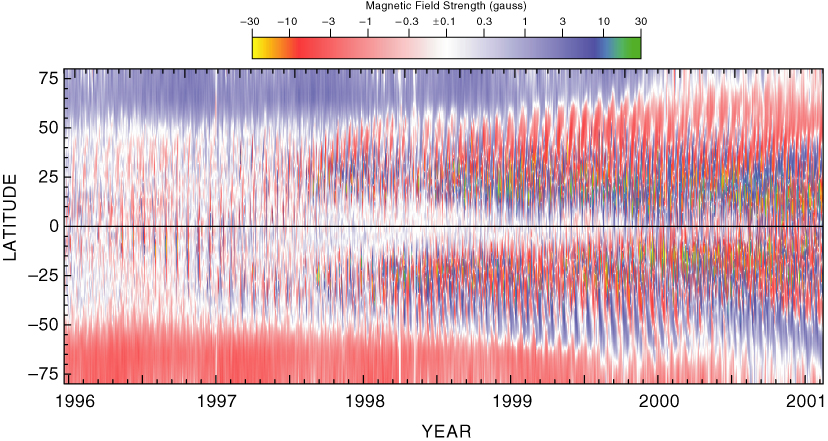
This figure shows magnetic fields using a color coding system. Magnetic fields have two different polarities which are represented as either blue or red for the weaker fields or as either green or yellow for the stronger fields. The conversion between color and field strength is given in the chart above the figure. As the sun rotates, successive portions of the solar surface pass across the center of the apparent solar disk. Each vertical line represents a strip from the north to south solar poles of rotation and the color gives the field strength as a function of latitude at the time the strip crosses this disk-center line. The regular repetition of the pattern comes from the fact that the fields last for many rotations and cross the disk center many times. Note that magnetic fields are present even during sunspot minimum which occurred in 1996.