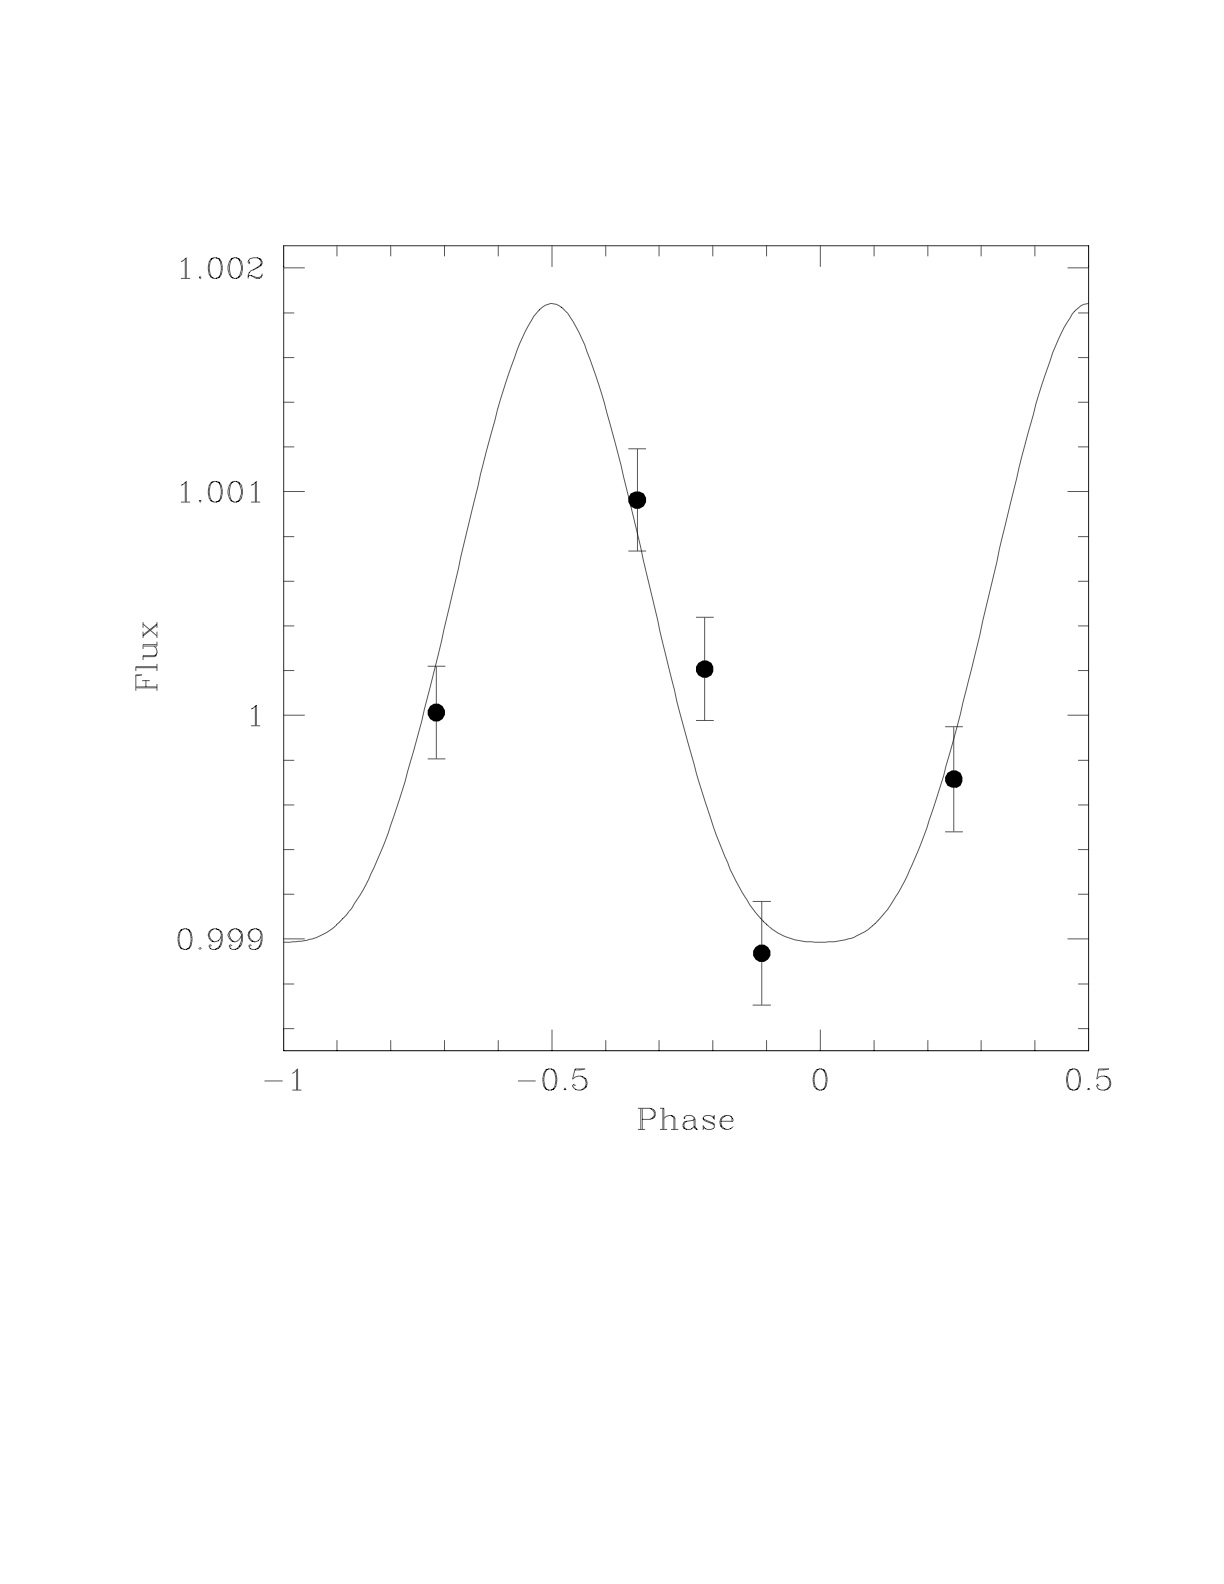
Shown at left is the measurement we actually made. The horizontal axis represents the phase of the orbit (that is, the planet makes a single orbit about the star as the phase goes from 0 to 1). At five times during the course of a single orbital period, we measured the brightness of the star+planet system. The points and associated error bars show how the brightness varied, relative to the value measured at the first epoch.
The solid line then shows the expected variation if the planet reradiates the absorbed energy from a hotspot as it goes around the star. This model is strongly constrained by the radial velocity measurements and the only parameter to be determined is the overall amplitude. Therefore, the agreement is very encouraging.
We like the Extrasolar Planets Encyclopedia . This site has a technical focus, but it summarizes all the measurements and scientific work. If you want to go straight to the source on any particular planet, or if you want to get lists of planet properties or generate plots of planet properties, this site is one-stop shopping. Some of the major observational programs also maintain websites where you can get up-to-date information. These include the California & Carnegie group and the Geneva group.
An excellent website describing the present and future NASA plans for studying extrasolar planets is PlanetQuest .
The underlying theme of the search for extrasolar planets is, of course, the desire to discover and study life on other planets. Much of the work on Astrobiology in the United States is funded through the NASA Astrobiology Institute .