|
Mt. Wilson Solar Photographic Archive Digitization Project |
|||
The Mount Wilson Archive
This material is based upon work supported by the National Science Foundation under Grant No.0236682
Any opinions, findings, and conclusions or recommendations expressed in this material are those of the author(s) and do not necessarily reflect the views of the National Science Foundation
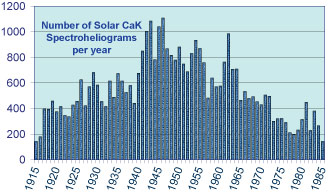
This project has digitized essentially all of the CaK. Solar images and step wedge images (available after 1962) have been extracted and identified with original logbook parameters of observation time and scan format. 39,261 800 by 800 CaK FITS files are available for the years 1915 to 1985. Summary listings of the radius solution results are found in each year's directory. Fits file information gives a brief radius algorithm description and a listing of the quantities in the summary files in each yearly directory. Checkout Sheets for the Broadband Direct Series list the plates brought to UCLA for scanning. A presentation given at the AGU 2004 winter meeting can be downloaded. One version uses a 130Mbyte avi Movietone clip from 1930. A second version uses a 20 Mbyte avi of the movie clip. Both video clips are played from inside the powerpoint presentation. Anther powerpoint file used for a 10-minute talk given by Ulrich at UCLA is also available.
Full Size (2600 by 2600) Raw tiff and dust&pits corrected 16-bit fits files are in directories Extracted and Full respectively.
The Diagnosis directory has four types of file: a .txt file giviing the reduction printout, a dust file for which the dust and pits correcion has
not been made, an rms file giving the rms for each 5 by 5 sub array and a slope file showing the position of the radius circle.
Intensity calibration is described in: Characteristic Curve Calibration Report
The following data resources have not yet been recovered. Fortran processing codes for the step wedge images and intermediate output are available.
Fitting curves are available for 1961, 1962 and 1963
Intensity files from the above curves have been adjusted to correspond to the canonical solar limb darkening curve. Summary pdf files can be found in the monthly directories. For the pdf intensity files, contours are provided at intensities of 1.10, 1.7434, 2.7631, 4.3792, 6.9405, 11.0 and 17.434 times the disk center quiet sun intensity.
The above processing has been superceded by the running median filter approach: Flat-fielded images based on a running median filter. The procedure is described in a paper by Bertello, Ulrich and Boyden ads: 2010SoPh..264...31B.
Multiple files can be obtained through the Virtual Solar Observatory
Access yearly pdf files with enhanced contrast here. Use these flat fielded images for quick-look quality assessment. Each yearly pdf file permits rapid scrolling in Acrobat. The months June to October 1939 are missing due to the deconstruction and reconstruction of the tower to relocate the optical axis within the tower. The month of March 1944 is missing due to heavy snow.
KEYWORDS for the fits files are explained in this file.
The precise algorithms used are in the FORTRAN reduction code.
Sample scans from the Broadband Direct series are available for study along with comparisons to MDI images.
An interesting work by Hale and Fox, 1906, describes an early application of Kenwood Observatory photographic material to the study of solar rotation.
The photographic plates and emulsions show signs of deterioration. One defect mimics solar granulation both in terms of size and intensity distribution. This defect is present on plates for all time periods scanned so far.
The Laplacian filter mitigates the effect of emulsion dots of unknown origin.
This defect and others can be seen on magnified sections of contrast enhanced blank sky near the sun.
Storage and preservation of the plates and photos of our new Archive Lab can be seen here.
1960, Photographic Theory by James and Higgins, Chapter 1
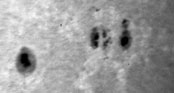
1906 Sunspots
|
G.E. Hale began the photographic record of the solar surface at the start of the 20th Century when he moved the Snow Telescope to Mt. Wilson and constructed the 60-foot tower telescope. This is a sample of one of the earliest broad-band solar images in the Mt. Wilson Archive. |
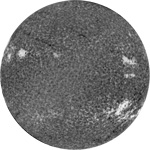
Calcium Spectroheliograms |
The program of Calcium spectroheliograms began prior to Hale's selection of Mt. Wilson for the observatory. The earliest plates were obtained at the Kenwood Observatory during a period between 1893 and 1897. The earliest plates are of variable quality. Beginning in 1906, several series of Calcium spectroheliograms were obtained at the 60-foot tower telescope and at the Snow telescope. Digitized forms of these images are included in the Digital Mt. Wilson Solar Photographic Archive. |